DATA SCIENTIST & ANALYST PORTFOLIO
PROJECT (1) - SALES MANAGEMENT
Introduction
Business Request & User Story
Data Cleansing & Transformation (Power Query Editor, Excel)
The Data Model
Dashboard
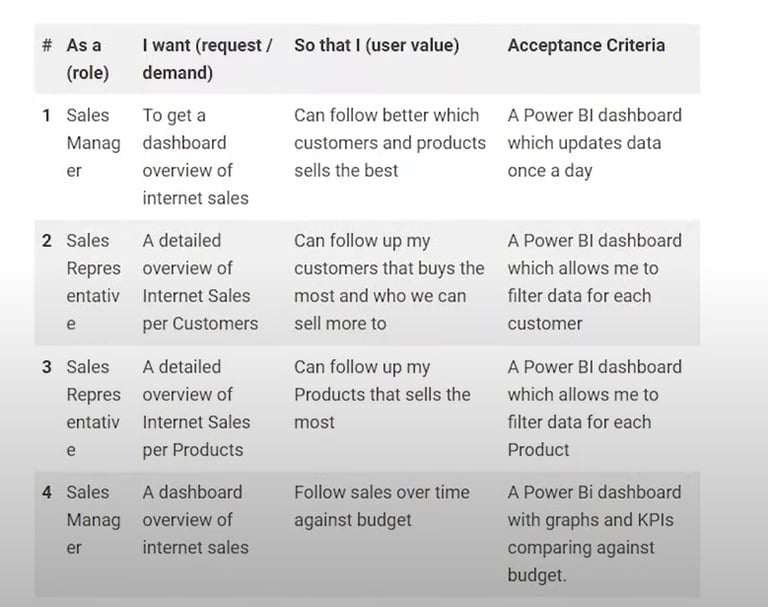
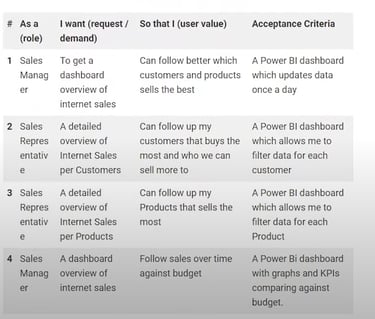
The business request for this data analyst project was an executive sales report for sales managers.
Based on the request that was made by this business, the following user stories were defined to fulfill delivery and ensure the acceptance criteria were met throughout the project.
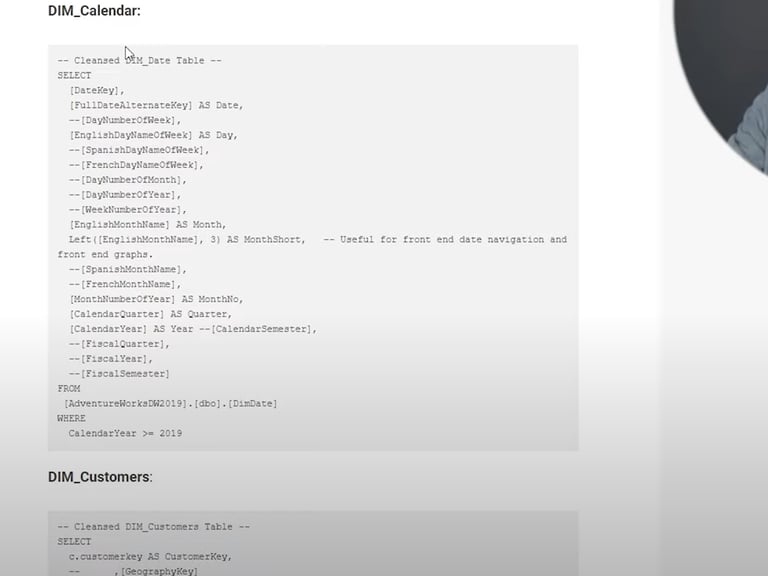
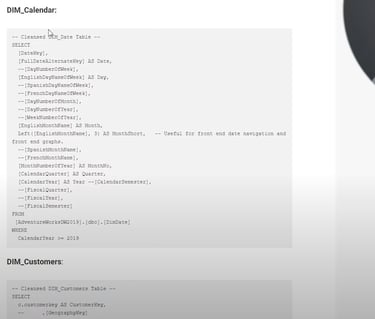
To create the necessary data model for doing analysis and meeting the business needs as defined in the user story, the following tables were extracted using Power Query Editor and Excel.
One data source (sales budgets) was provided in Excel format and was later connected to the data model in a later step of the process.
Below are Power Query Editor and Excel statements for cleansing and transforming necessary data.
This is for me; create a table for each column that you discovered error. Name the table after the column name e.g DIM_Product.
Then go to word and write the description of what and what you cleansed on that column and then screenshot it and paste in this portfolio e.g
---Cleansed DIM_Product Table----
SELECT
row 2column A,
add more data into the cell,
delete the entire row because no data was discovered.
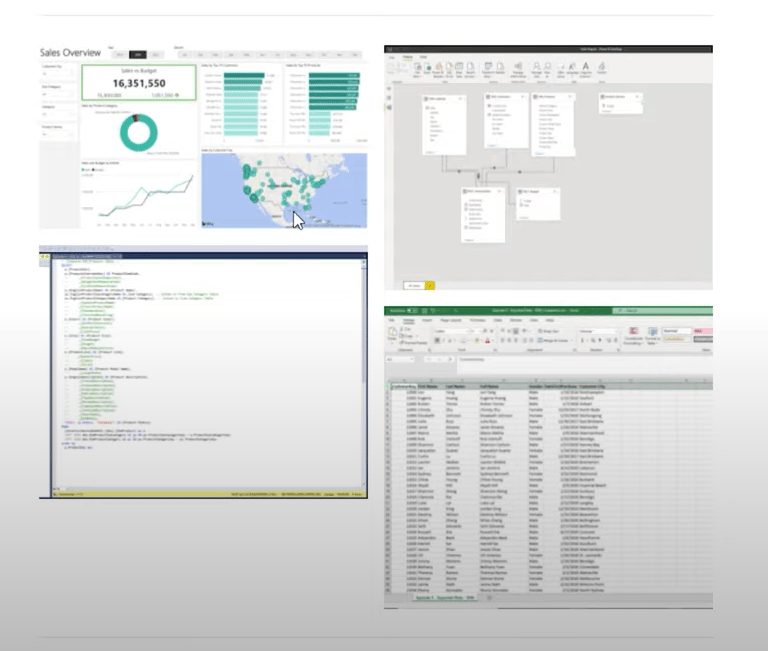
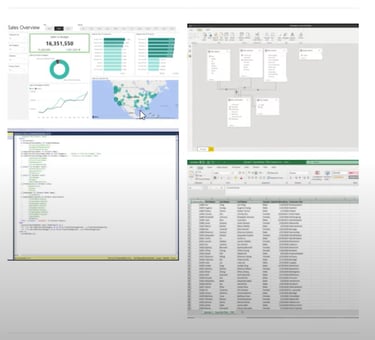
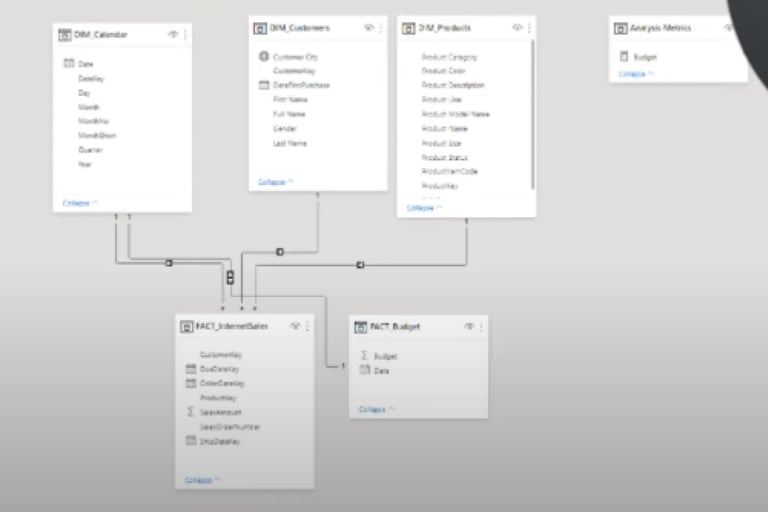
Below is a screenshot of the data model after cleansed and processed tables were read into PowerBI.
This data model also shows how FACT_Budget had been connected to FACT_internetSales and other necessary DIM tables.
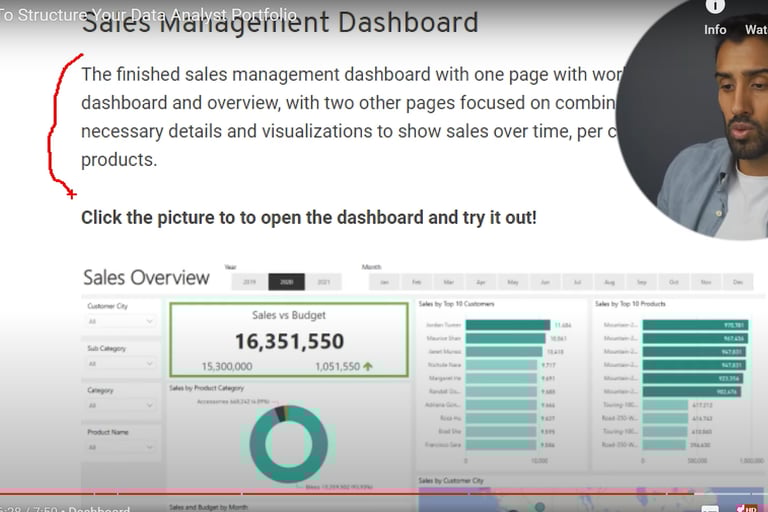
The built Sales Management Dashboard with two pages; the first page focused on the combination of necessary details and the visualisations to show sales over time, per click products.
Click the picture to open the dashboard and try it out! (I need to publish this dashboard on Microsoft PowerBI so it can come live)
for me; data modelling shows the backend result e.g the codes written